|
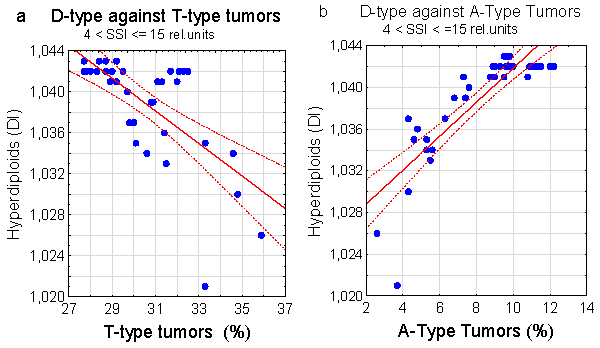
| Figure 7: Relationship between DNA-Index of D-type tumors and percentages of T-, and A-type tumors. Linear regression analysis was used to assess the relation between D-type tumors and T- (a) or A-type (b) tumors within an SSI interval 4<SSI≤15 relative units. A strong significant negative correlation appeared between decreasing D-type DI values of hyperdiploid tumors (1.020< DI≤1.044) and increasing percentages of T-type tumors (r = −0.68, p <0.0001; n = 37). A similar but positive correlation appeared regarding the percentage of A-type tumors (r = 0.84, p < 0.0001; n = 37). |