 |
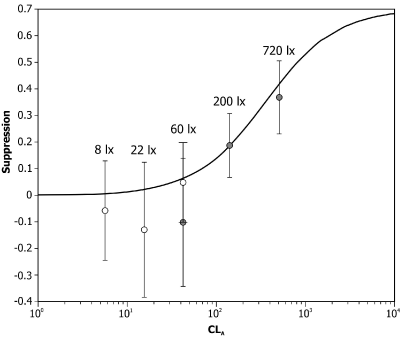
| Figure 2: Mean nocturnal melatonin suppression and associated 95% confidence intervals, for one-hour exposures of the 2670 K sources at different corneal illuminance (photopic lux) levels; open symbols are from the first study while closed symbols are from the second study. The continuous solid line represents the CS values for the white LED of 2670 K at different CLA levels according to equation 1 and the revised spectral sensitivity function for nocturnal melatonin suppression [6]. It should be noted that the functional relationship between CLA and CS is plotted without regard for the measured nocturnal melatonin suppression values obtained in the present study. |