 |
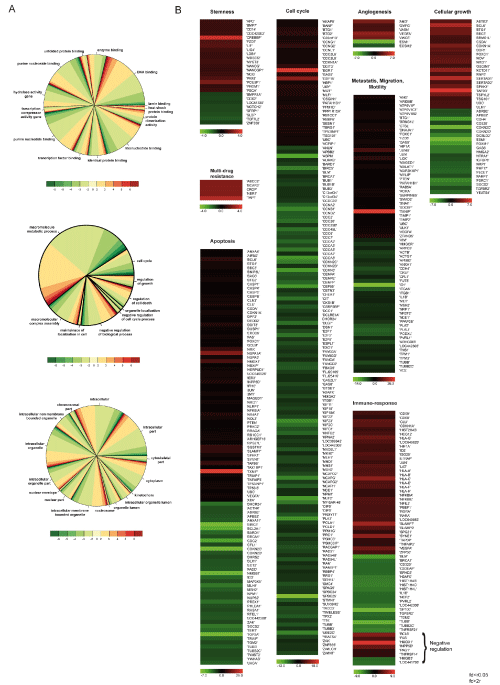
| Figure 3: Gene ontology and expression data. A) Gene Ontology (GO) pie chart of the total list of 1,405 genes classified according to molecular function (MF, upper), biological function (BP, middle), and cellular component (CC, lower); B) Heat-map (obtained using the MEV platform) showing the expression fold change of genes (with two fold or more) divided into 9 clusters according to GO terms. Red/green indicate an increase/decrease in gene expression. |