 |
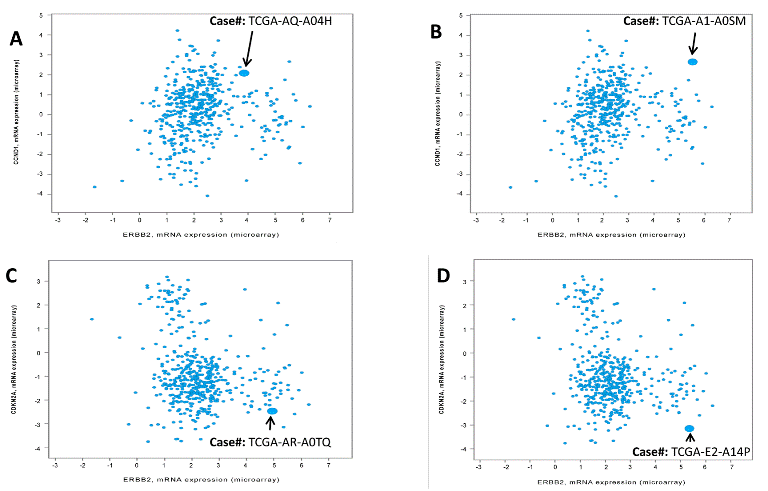
| Figure 3: Cyclin D1 (CCND1) (A and B) or p16INK4A (CDKN2A) (C and D) expression (Y-axis) Plotted against erbB2 mRNA expression (X-axis) for all tumors (cases). Each arrow points to a Representative case where there is either co-amplification of both erbB2 and cyclin D1 gene (A and B) Or ERBB2 gene amplification accompanied by p16 homozygous deletion(C and D). |