 |
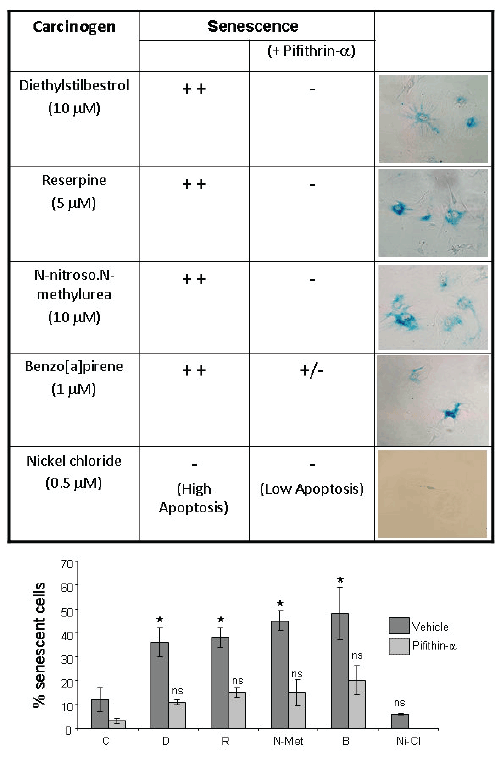
| Figure 4: Figure showing the effect observed with severalcarcinogens tested in naïve MEFs. Upper table shows a resume ofthe results. Bottom graph shows the averaged quantification ofthree independent experiments. Barrs show SD *: p<0.05, **:p<0.01, ***: p<0.001, Student’s T test. All values were compared tountreated control cells for statistical significance. |