 |
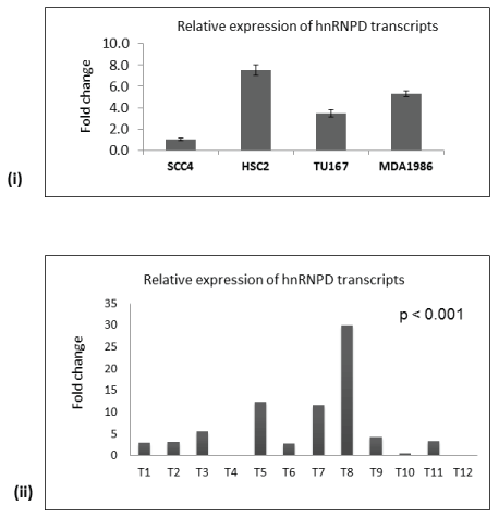
| Figure 1a: Analysis of hnRNPD expression in oral tissues. (A)Quantitative real time PCR (qPCR) analysis of hnRNPD transcriptsin oral cancer cells, OSCCs and normal tissues. Histogram showingthe relative abundance of hnRNPD transcripts in (i) oral cancercells (SCC4, HSC2, Tu167 and MDA1986); (ii) OSCCs and pairednormal tissues. hnRNPD mRNA levels were significantly higher inoral OSCCs patients as compared to normal oral mucosa (p ≤0.001, Mann- Whitney U test). Bar graph data is represented byfold changes of OSCCs samples after normalization with pairednormal tissue samples. |