 |
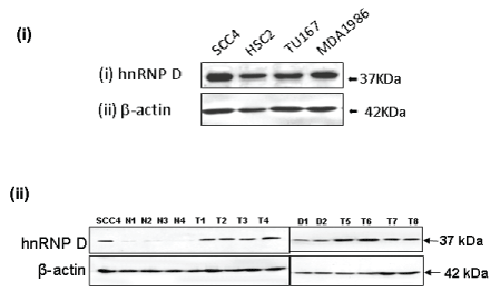
| Figure 1b: Analysis of hnRNPD expression in oral tissues. (B)Western blot analysis. Photomicrograph showing proteinexpression of hnRNPD in (i) oral cancer cell lines (SCC4, HSC2,Tu167 and MDA1986); (ii) tissue lysates obtained from normal oralmucosa (N1 – N4), oral dysplasia (D1, D2) and OSCCs (T1- T8).Panel shows increased expression of hnRNPD in dysplasia (D1, D2)and OSCCs (T1-T8) as compared to normal mucosa (N1-N4).Whole cell lysates prepared from SCC4 cells was used as a positivecontrol. β-actin was used as loading control (lower panel). |