 |
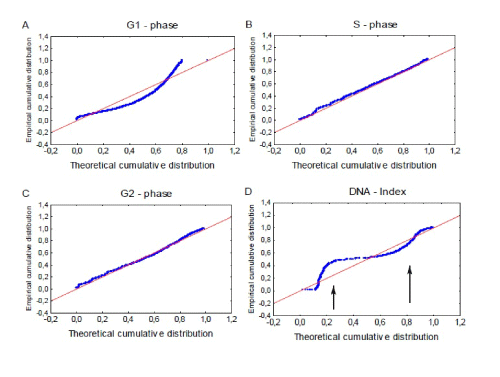
| Figure 5: Probability-Probability plot. Empirical cumulatively estimated cell cycle parameters were plotted against a theoretical cumulative distribution. A deviation from the theoretical curve was found for the G1-phase curve (A) and was most prominent for the DNA index (D). At the two arrows, a prominent increase in the DI-curve was found. Values for SPF (B) and G2 phase (C) appear well adjusted to the theoretical curve. |