 |
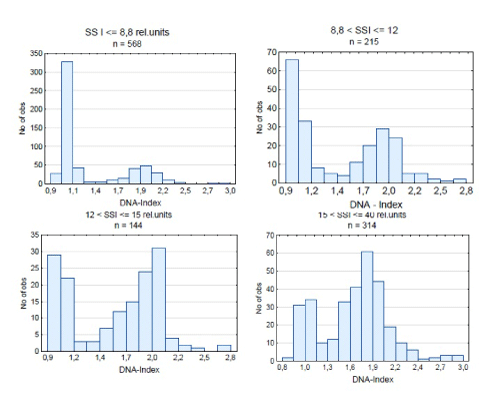
| Figure 6: DNA histograms in increasing SSI intervals. (A) D-type tumors predominate for SSI ≤ 8.8 relative units with some T- and A-type tumors. A slightly enhanced T-type population is seen in SSI interval 8.8–12 (B) and reaches a peak in the SSI interval 12–15 (C). A-type tumors dominate in the 15–40 SSI interval (D). |