 |
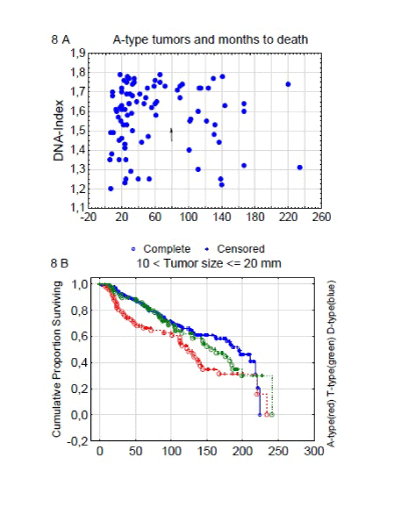
| Figure 8: Patient survival with A-type tumors. (A) The plots shows the time (in months) until death for patients with A-type tumors in the triploid DI region (1.2 ≤ DI<1.8). Two populations of tumor appeared on both sides of the 80-months survival point, which differed significantly in both survival time and size. Patients experiencing longer survival had tumors significantly smaller in size compared with short-term survivors. (B) Kaplan-Meier survival curves are shown for the three ploidy types (DA-T) within the tumor size interval of 10–20 mm, within which the second tetraploidization occurred. A bimodal distribution of A-type tumors is apparent. |