 |
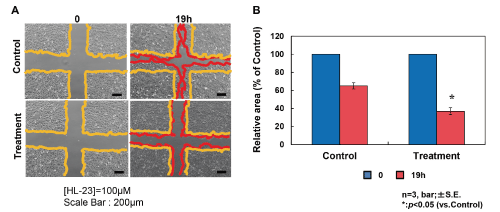
| Figure 6: Inhibitory effects of HL on the migration of A549 cells using scratch wound assay. (A)Yellow lines indicate initial wound area; red lines demarcate migrating cells. Scale bar; 200 μm. (B) Relative area of migrated A549 cells in the presence or absence of HL for 19 h. Data represent the mean (n=3) ± S.E. *Significant difference from (p<0.05) from Control calculated using by Student’s t-test. HL, [DMPC]=100 μM, [C12(EO)23]=11 μM. |