 |
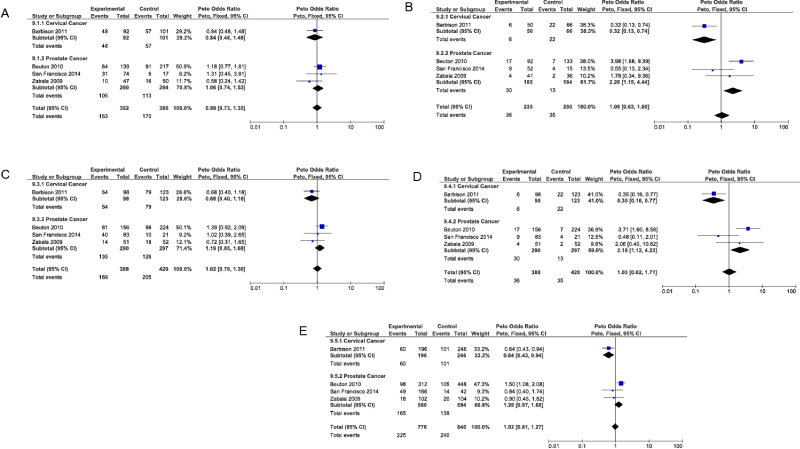
| Figure 2: Forest plot of prostate and cervical cancer risk associated with the RNASEL R462Q polymorphism for the heterozygous (A), homozygous (B), dominant (C), recessive (D), and allelic (E) genetic models. The squares and horizontal lines correspond to the studyspecific OR and 95%CI, respectively. The area of the squares reflects the study-specific weight. The diamond represents the pooled OR and 95%CI. |