 |
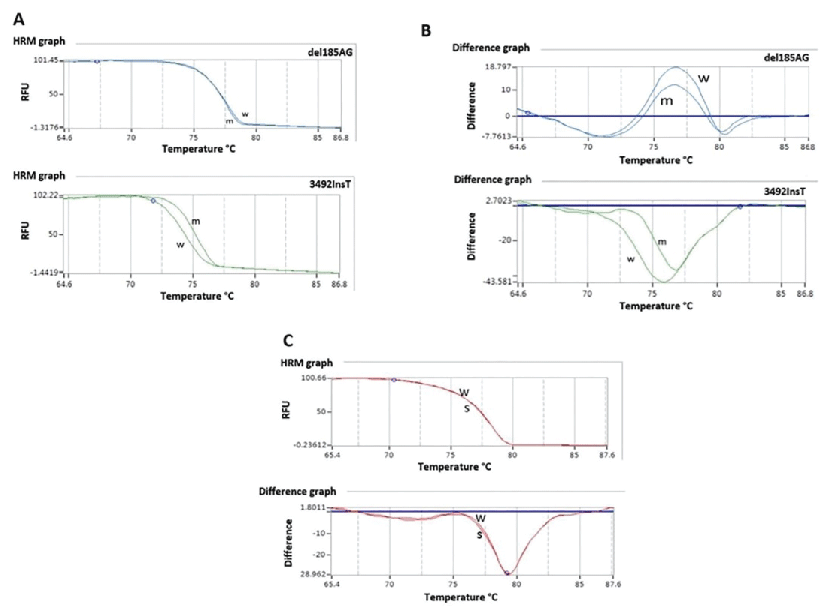
| Figure 2: HRM analysis for one sample of BRCA1 (del185AG) and one for (BRCA2 3492Inst), panel A shows the HRM plot for BRCA1 and BRC2, and panel B shows the difference plot of the same positive samples were we can see the behavior of the amplification product melting and the differences between the samples and synthetic sequences of the wild type phenotype. Panels C shows both the HRM graph and the difference graph between the sample of one healthy volunteer and synthetic control for one mutation in the BRCA1 gene (BRCA1 330AG) showing no difference between them, this to show the specificity of our method. |