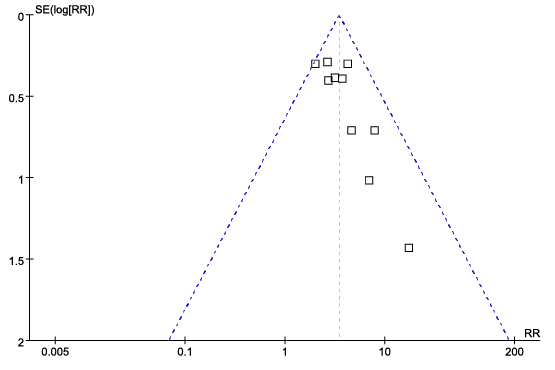
Figure 5:
Funnel plot of pretreatment CEA level and pCR rate