 |
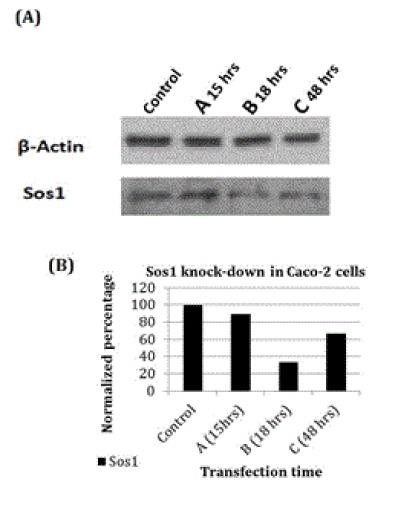
| Figure 2: siRNA efficiency to knock down Sos1 gene in Caco-2 cells. (A) Western Blot showing the effect of siRNA treatment at different time intervals on Sos1 protein expression in the Caco-2 colorectal cancer cell line. CTRL represents the untreated control sample. β- Actin expression was utilized as housekeeping gene for calibration. (B) Quantification of the Sos1 knockdown efficiency at the protein level using an image analysis software “the Image J software”. Sos1 expression is normalized to the corresponding level of β-Actin and represented as a percentage of the Sos1 expression in the control sample. |