 |
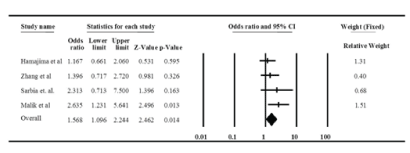
| Figure 3: Forest plots of the association between NQO1609C>T (codominant model; CC vs. TT) polymorphism and GC risk. The random-effects model was used to calculate the pooled effect estimates. The squares and horizontal lines correspond to OR and 95% CI of specific study, and the area of squares reflects study weight (inverse of the variance). The diamond represents the pooled OR and its 95% CI. |