 |
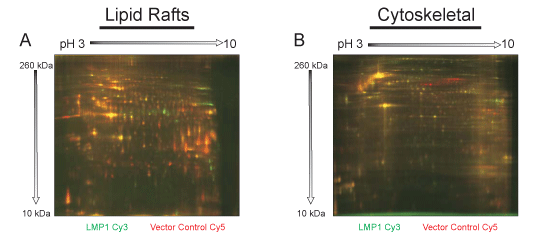
| Figure 4: 2D DIGE analysis of lipid rafts and cytoskeletal fractions from LMP1 expressing cells. (A) Lipid rafts and the remaining (B) cytoskeletal pellet from sucrose density gradients were isolated from Rat-1 cells expressing LMP1 or vector control. Equivalent amounts of total protein in 2D lysis buffer were labeled with the indicated CyDye and separated by 2D gel-electrophoresis. Gels were scanned using a Typhoon scanner and analyzed by Decyder software. Protein spots higher in LMP1 samples are green, those higher in vector control samples are red, and yellow spots represent proteins that are approximately at the same level between samples. |