|
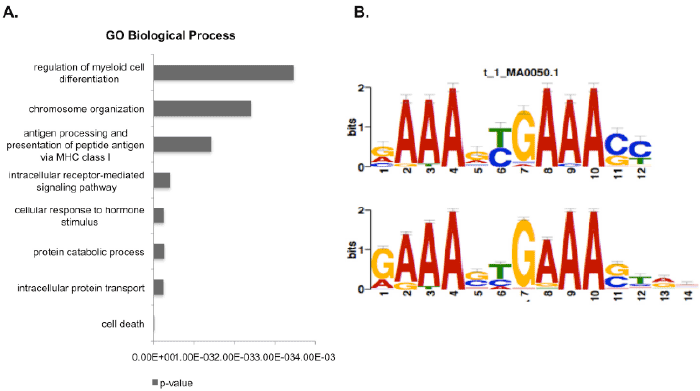
| Figure 2: Cell death is the top biological process enriched in genes associated with IRF1 peak regions A. The graph displays significantly enriched biological processes (shown as p-value) based on the gene ontology of genes in close proximity to IRF1 peak regions (within 10 kb upstream of a TSS) from IFN-gamma stimulated cells B. Shown is the logo derived from Motif analysis using MEME-ChIP for annotated genes categorized under cell death versus the consensus motif for IRF1 (e-value, 1.2e-73). |