 |
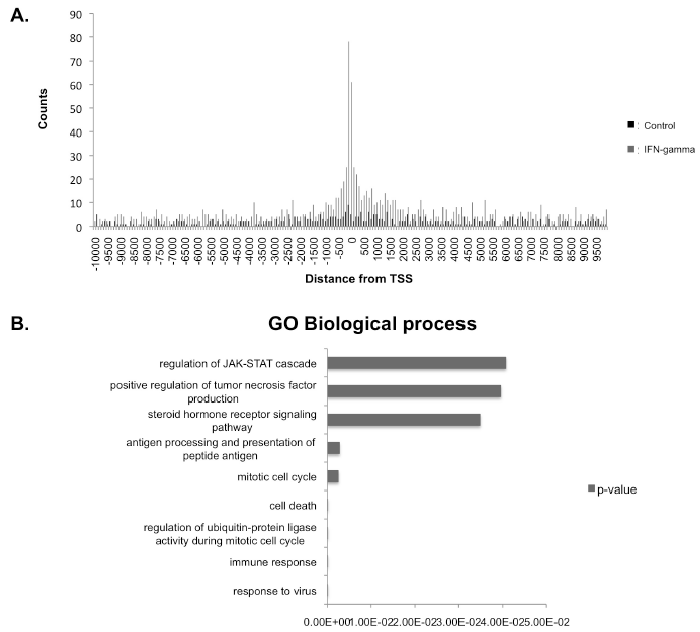
| Figure 4: IRF1 peak regions are clustered around the transcriptional start sites (TSS) of genes in IFN-gamma stimulated cells A. The graph depicts the peak region counts versus distance from the TSS of a coding region (GPAT) for control (unstimulated) and IFN-gamma stimulated cells B. Shown are enriched biological processes for peak regions from IFN-gamma stimulated cells centred around 1 kb to 2 kb from the TSS. Graph shows the corresponding p-value. |