 |
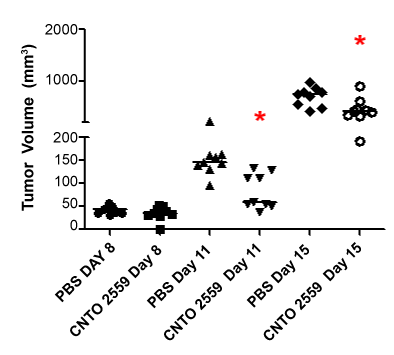
| Figure 8: Effect of Tumor Suppression with anti-TF Antibody. Primary tumor volumes show statistically significant suppression of tumor growth on Days 11 and 15 for animals treated with anti-TF antibody, compared to PBS controls. The final median tumor volume for each group is shown. Asterisk (*) indicates statistically greater than control, Wilcoxon Signed Rank Test (P<0.05). |