|
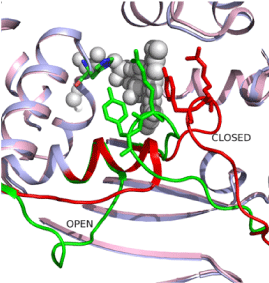
| Figure 3: The open and closed conformations of the 30-loop and 90-loop/ substrate binding loop. Ribbon drawings for the protein chains (PDB code: 1O26 (light blue) and PDB code: 1O24 (light pink). The open and closed conformations are shown in green and red. The His53, Arg90, Tyr91 residues are shown by stick representation and the FAD molecules in spheres. |