 |
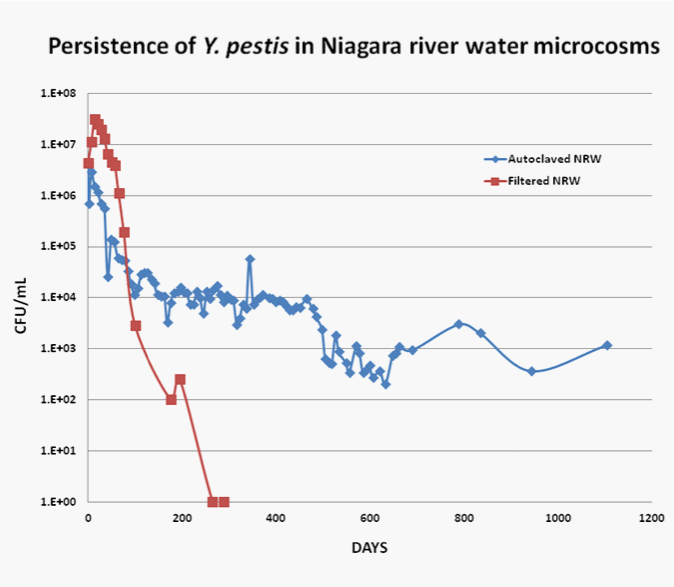
| Figure 1: The persistence of Y. pestis in Niagara River water microcosms is depicted in colony forming units per milliliter (CFU/mL) as a function of time (days). The two types of microcosms shown are autoclaved (♦) and filtered (■) Niagara River water. Error bars are not present for clarity. The standard deviation of each point falls within 50% of the plotted number for the first year and within 100% for subsequent years. |