 |
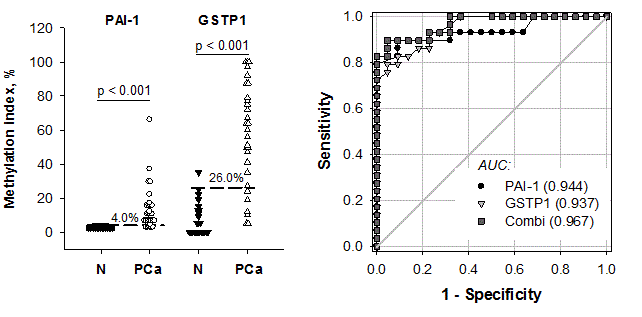
| Figure 4: Methylation degree of PAI-1 and GSTP1 analyzed using MSRE-qPCR in serum DNA of patients with prostate carcinoma (PCa, n=29) and healthy individuals (N, n=22). (A) Histogram: Dotted lines show the cutoff values. Statistical difference was calculated by Mann- Whitney rank sum test. All analyses were performed in triplicates. (B) Receiver-Operating Characteristic (ROC) curves comparing sensitivity and specificity of MSRE-qPCR assay applied for PAI-1 gene methylation, GSTP1 gene methylation and the combination of both markers. The AUC values (in brackets) were calculated with SigmaPlot 11.2. All analyses were performed in triplicates. |