|
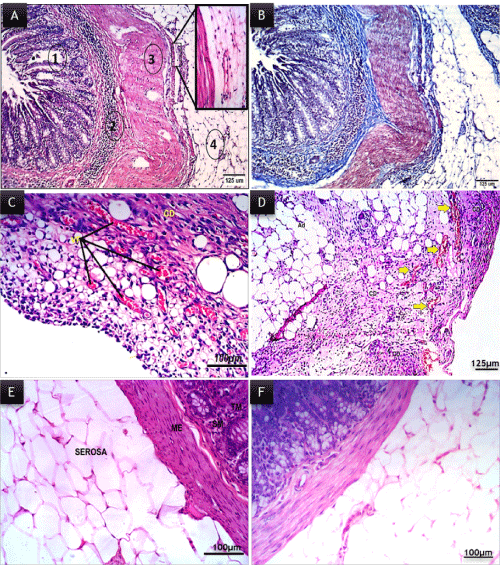
| Figure 2: Grades of fibrosis. (A) No collagenous fibrosis in the cecal wall of a rat from negative control group A (H&E X100 bar = 125 μm). (B) No collagenous fibrosis in the cecal wall of a rat from positive control group B (MT X100 bar = 125 μm). (C) Cecal wall of a rat from saline treated non-diabetic group showed massive fibrin strands deposition extends outward with scattered spindle shaped fibroblasts, invasion of different inflammatory cells and newly formed capillary with erythrocytes (arrows) (H&E X200 bar = 100 μm). (D) Cecal wall of a rat from saline treated diabetic group showing moderate degrees of fibrosis, mononuclear cell infiltration, edema and capillary vascular proliferation compared with those of group C, (E) Cecal wall of a rat from garlic oil treated non-diabetic group and (F) of a rat from garlic oil treated diabetic group showing normal serosa with absence of collagenous fibrosis (H&E X200 bar = 100 μm). |