 |
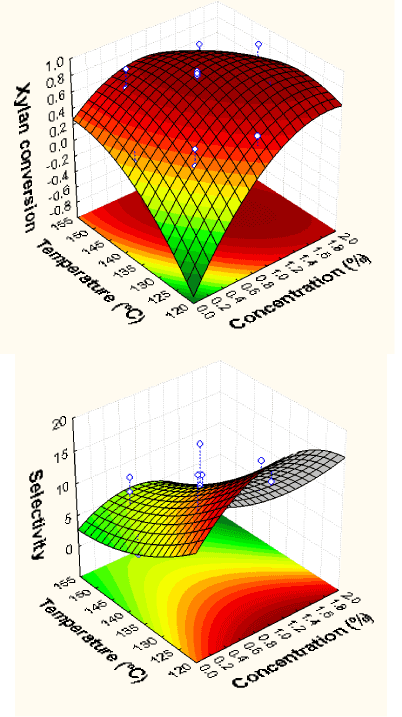
| Figure 4: Response surfaces and contour plots of modeled xylan conversion to xylose (top) and hydrolysis selectivity (bottom) as a function of reaction temperature (T,ºC) and acid concentration (C, %) at fixed reaction time of 45 min set as a central point. |