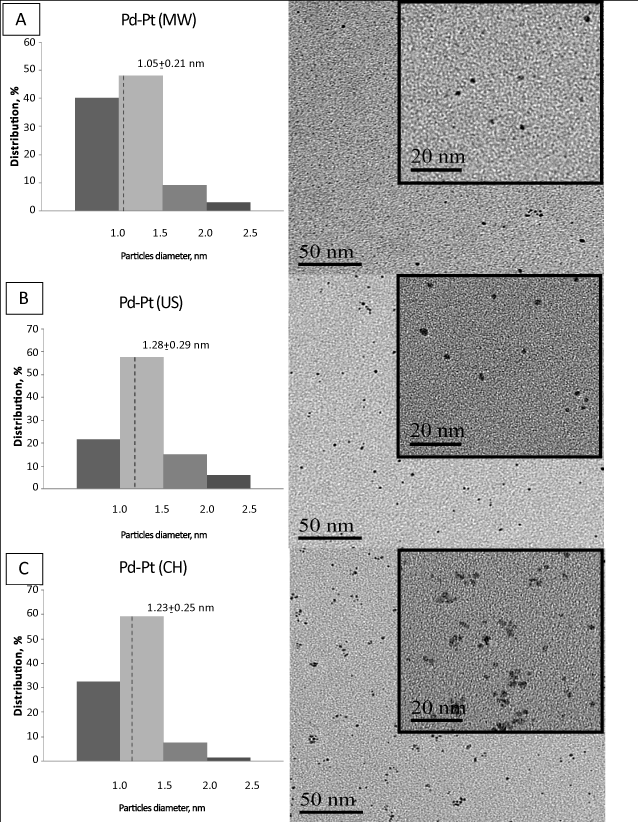
Figure 2:
TEM image of Pd-Pt bimetallic nanoparticles with the histogram chart of particles size distribution that has been prepared via; (A) microwave (MW) ;(B) ultrasonic irradiation (US) and, (C) conventional heating (CH)..