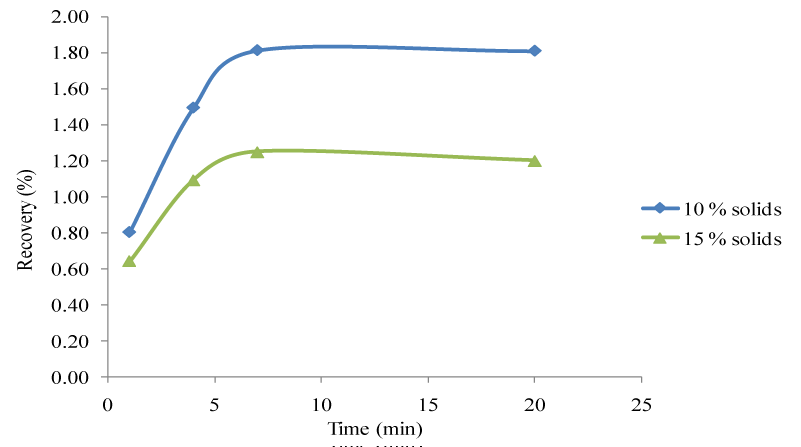
Figure 7:
Graph of time versus recovery for slurry at 10 % and 15 % solids (sieved).