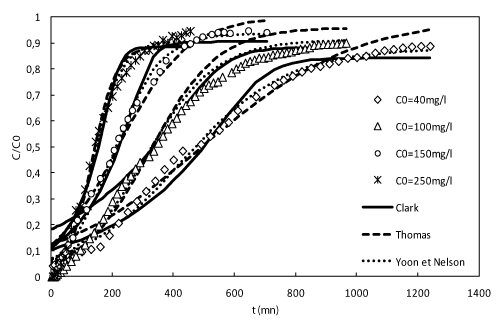
Figure 11:
Comparison between the measured and predicted breakthrough curves with different models at various influent concentrations (GACA, Q=8.4 ml/min, H= 15cm).