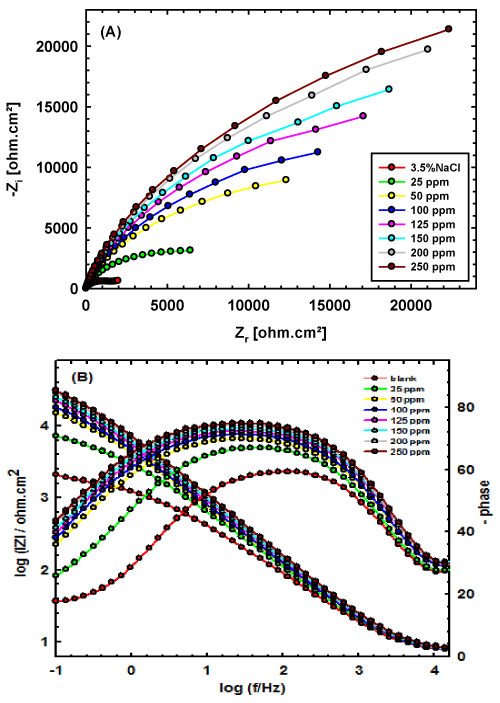
Figure 7:
Electrochemical impedance spectra for brass in 3.5% NaCl containing various concentrations of SOTB (a) Nyquist plots (b) Bode plots and phase.