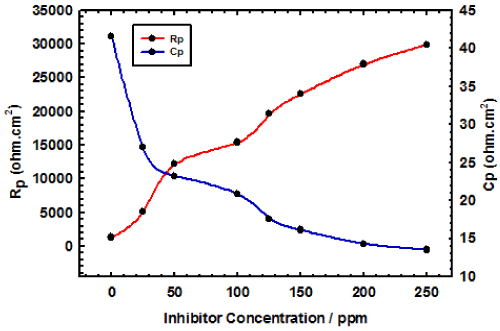
Figure 9:
The change of the impedance and capacitance determined from EIS curves as a function of SOTB concentration.