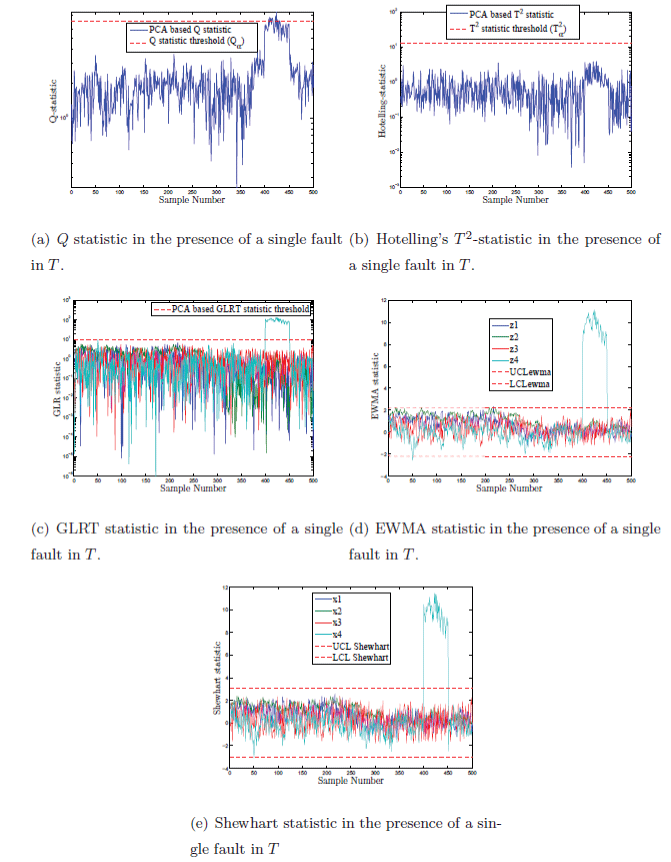
Figure 4:
The time evolution of the T
2
, Q, GLRT, Shewhart and EWMA statistics on a semi-logarithmic scale in the presence of a single fault in T.