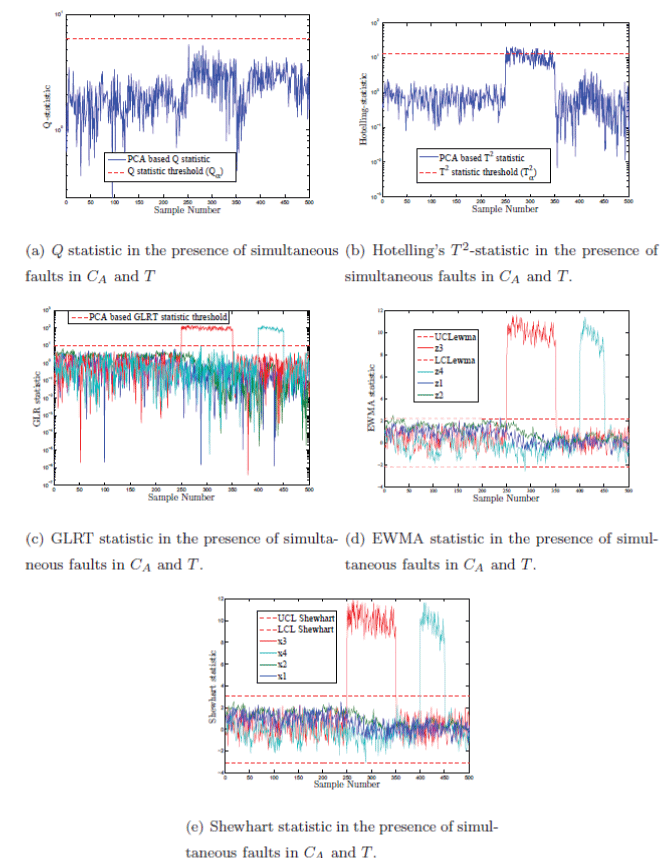
Figure 5:
The time evolution of the T
2
, Q, GLRT, Shewhart and EWMA statistics on a semi-logarithmic scale in the presence of simultaneous faults in C
A
and T.