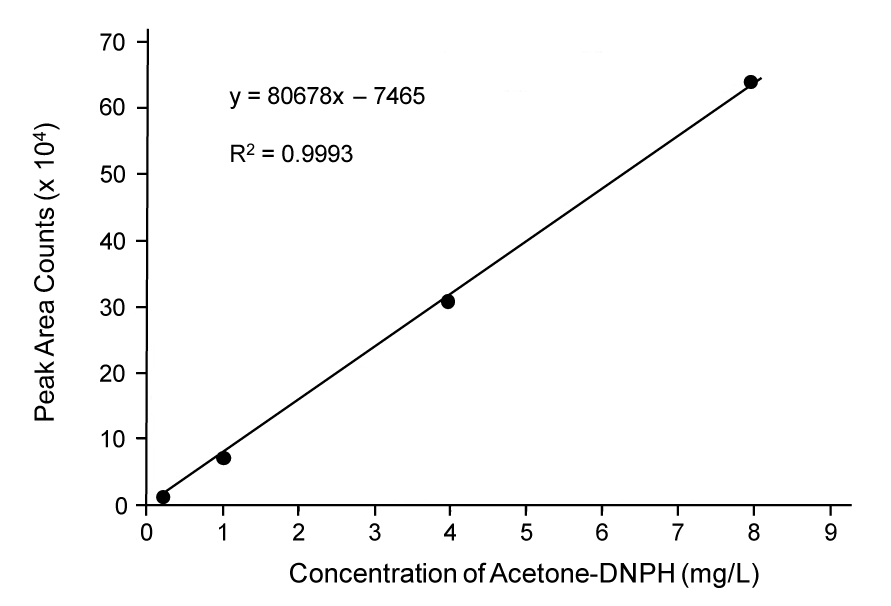
Figure 3:
The calibration curve used for the quantitative analysis of acetone in water samples.