 |
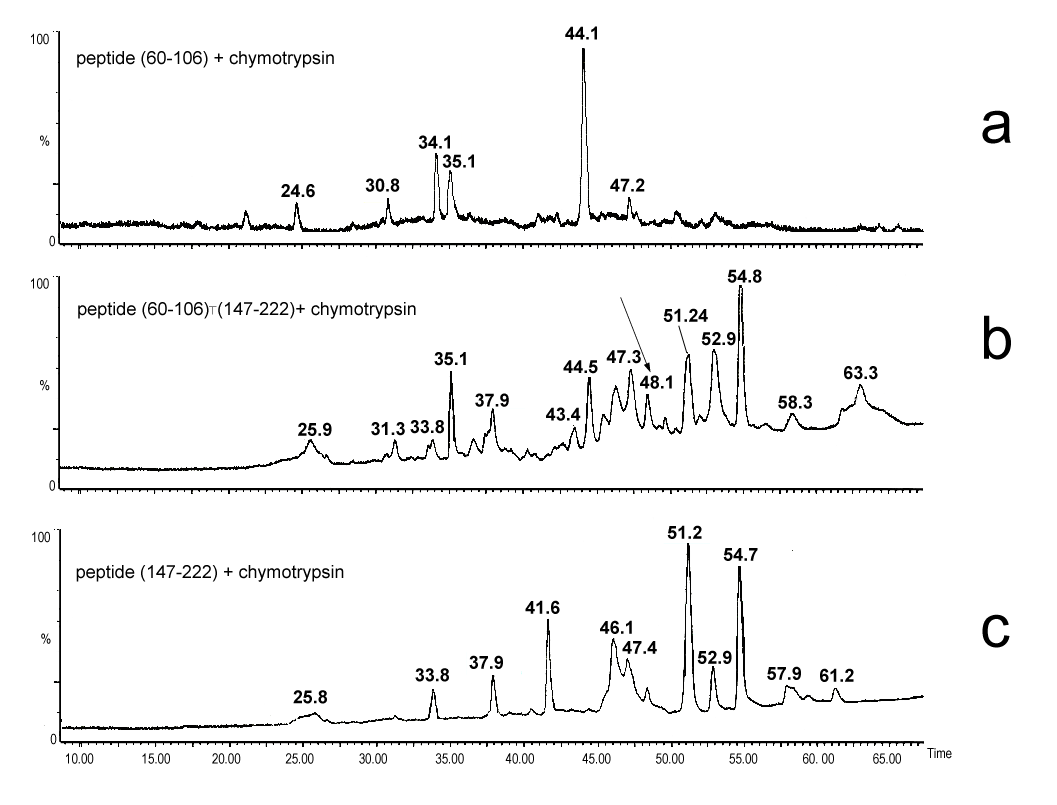
| Figure 8: LC-ESI-MS analysis of chymotryptic hydrolysate of transamidated peptide (60-106)T(147-222) (panel b) compared to chymotryptic hydrolysate of native peptides 60-106 (panel a) and 147-222 (panel c). The peak at tR 48.1 min (marked with an arrow) contains two transamidated peptides identified as (68-77)T(191-203) (MH+ 2607.2) and (93-106)T(191-203) (MH+ 3036.4 Da) (Table 2). |