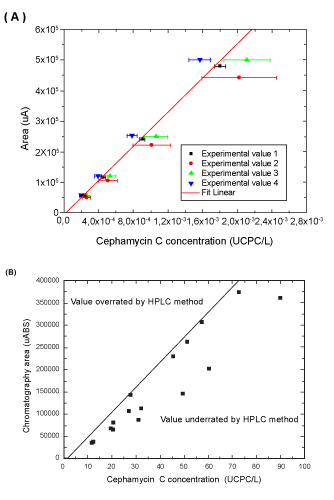
Figure 5:
(A) Calibration curve for quantification of Cephamycin C in UCephamycin C, and (B) comparison between Cephamycin C values determined by the proposed method (line) and those obtained by bioassay (dots).