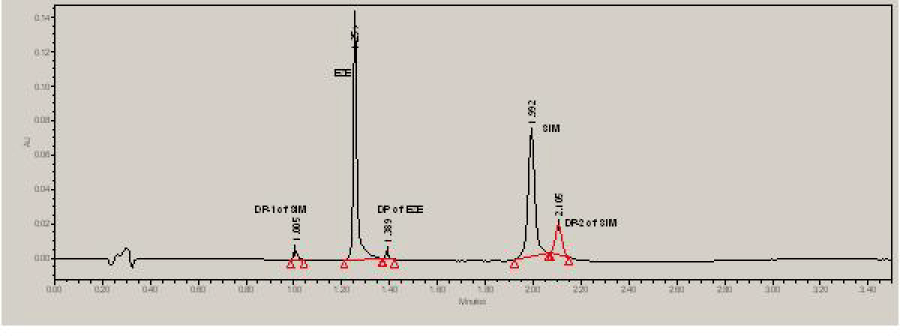
Figure 4:
Chromatogram of base degraded sample containing EZE and SIM.