|
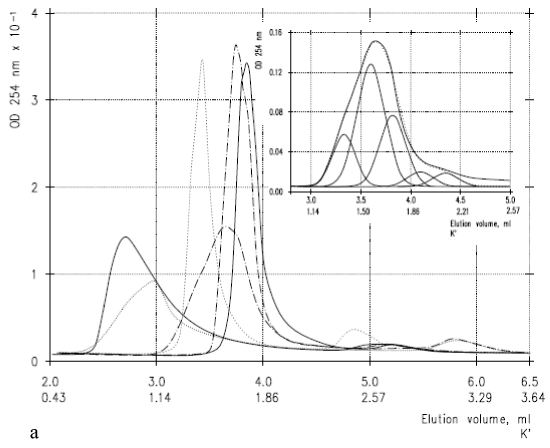
| Figure 1a: Main panel: absorbance at 254 nm of the diol column described under “Chromatographic procedures”. SP was solubilized in 10 mM H3PO4 pH 2.27 plus a NaCl mM concentration of: 0 (thin solid line), 50 (thin dotted line), 100 (thin dash-dotted line), 150 (thick solid line), 200 (thick dotted line) and 500 (thick dash-dotted line). Insert: deconvolution of the peak centered at K’ = 1.61 in the main panel (solution buffer 100 mM NaCl). Thick solid line represents the original chromatogram, thin solid lines represent the calculated Gaussians, dotted line represents the sum of the Gaussians. Deconvolutions as described under “Data analysis”. |