|
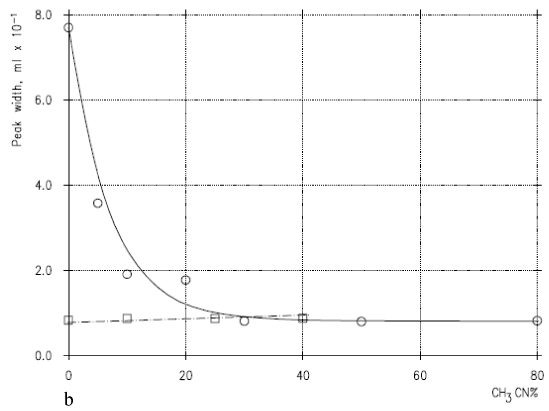
| Figure 3b: Corrected peak width of SP (circles and solid line) and Tyr-Gly (squares and dash-dotted line) fractionated by the TSK G2000SW of figure 3a as function of the solution buffer CH3CN concentration. Symbols represent experimental points; lines represent exponential decay and first degree polynomial interpolations for SP and Tyr-Gly, respectively. |