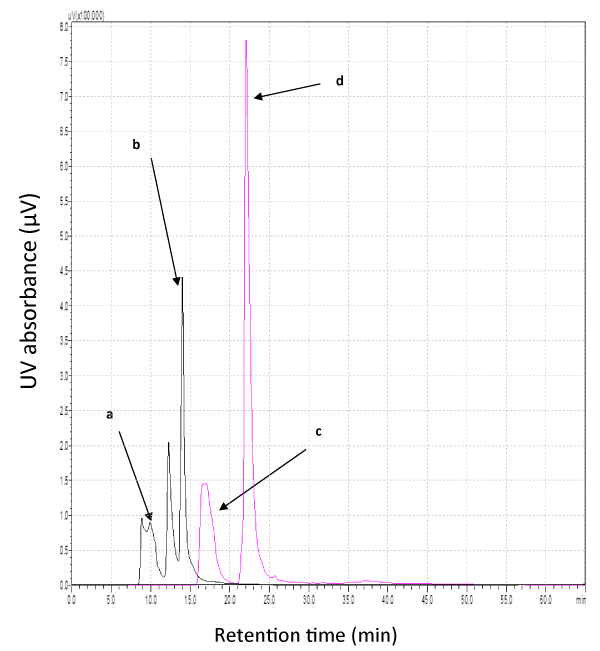
Peak labels indicate: a) inosine spiked in urine. RT=12.2 min b) adenosine spiked in urine. RT=14.0 min c) Inosine standard RT=16.8 and d) adenosine standard. RT=22.1 min.
|
| Figure 4a: The effect of change in analyte matrix on detection at 254 nm
– urine v/s water as matrix for inosine and adenosine detection. ZIC HILIC
column (2.1 mm × 150 mm x 5 μm) at flow rate of 0.2 mL min-1 was used to
acquire the data. The mobile phases used were- 50 mM ammonium acetate:
acetonitrile (95:5 v/v) and 50 mM ammonium acetate: water: acetonitrile
(50:45:5 v/v). The gradient program is described in Table 1.
Peak labels indicate: a) inosine spiked in urine. RT=12.2 min b) adenosine spiked in urine. RT=14.0 min c) Inosine standard RT=16.8 and d) adenosine standard. RT=22.1 min. |