|
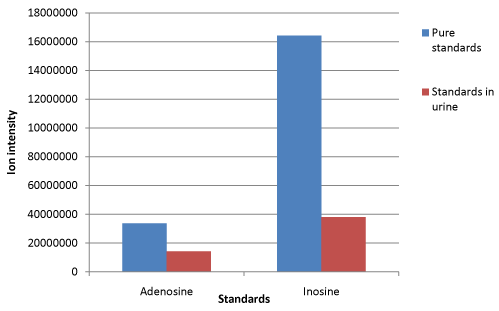
| Figure 4b: The matrix effect caused by urine on the ionization of standards with and without spiking in urine. The ion intensity comparison is shown between pure standards v/s the standards spiked in urine samples. ZIC HILIC column (2.1 mm × 150 mm × 5 μm) at flow rate of 0.2 mL min-1 was used to acquire the data. The mobile phases used were- 50 mM ammonium acetate: acetonitrile (95:5 v/v) and 50 mM ammonium acetate: water: acetonitrile (50:45:5 v/v). The gradient program is described in Table 1. |