|
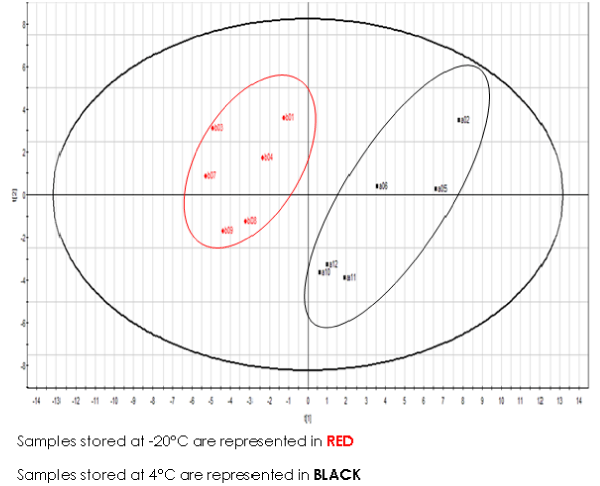
| Figure 5a: PCA plot for all 12 samples (six stored at 4°C and six stored at -20°C). All the observations were within the Hotelling T2’s 95% confidence. The X-axis represented t [1] which shows score t [1] for Principle component 1 (PC1) showing maximum variation in the dataset. The Y-axis represented t [2] which represents score t [2] for Principle component 2 (PC2) showing maximum variation not seen from just PC1. ZIC HILIC column (2.1 mm × 150 mm × 5 μm) at flow rate of 0.2 mL min-1 was used to acquire the data. The mobile phases used were- 50 mM ammonium acetate: acetonitrile (95:5 v/v) and 50 mM ammonium acetate: water: acetonitrile (50:45:5 v/v). The gradient program is described in Table 1. |