|
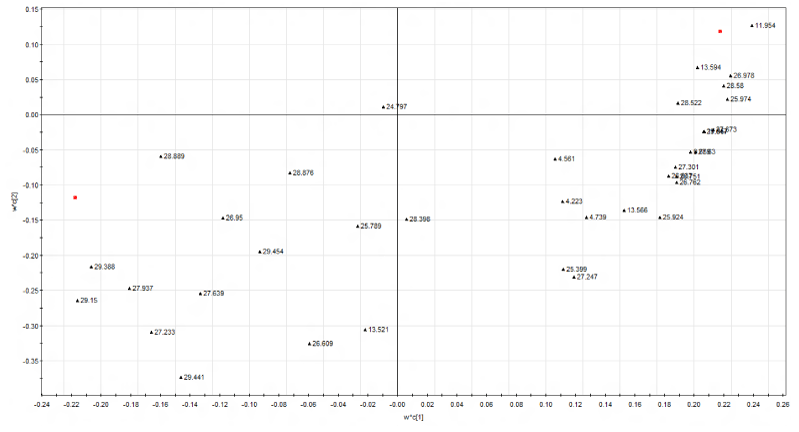
| Figure 5b: The loading plot showing variables that caused separation across both PC1 and PC2. Majority of well retained analytes in the bottom-right quadrant represent strongly the sample set stored at -20°C. X-axis (w*c [1]) represents the loadings corresponding to PC1, whereas Y-axis (w*c [2]) represents the loadings corresponding to PC2. w*c or loadings plot gives a graphical summary of the correlation between X and Y. |