|
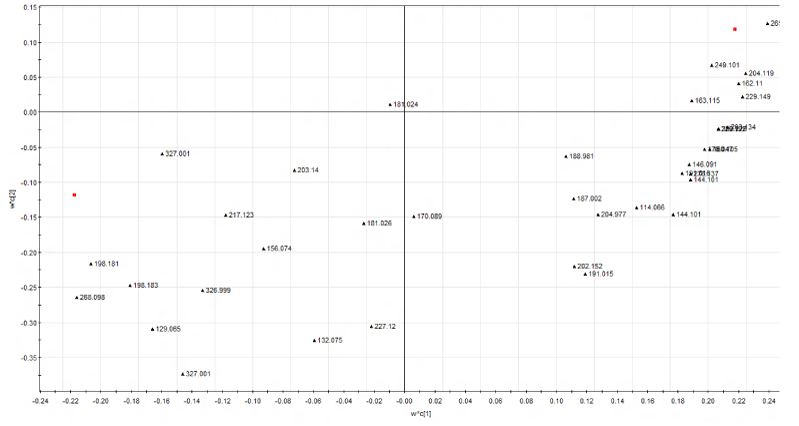
| Figure 5c: Loading plot corresponding to the separation between samples at 4°C and -20°C showed strong response from m/z 265.112, 249.101, 204.119, 162.11, 229.149 and 163.115. These ions strongly influence the behaviour of a sample at 4°C. X-axis (w*c [1]) represents the loadings corresponding to PC1, whereas Y-axis (w*c [2]) represents the loadings corresponding to PC2. w*c or loadings plot gives a graphical summary of the correlation between X and Y. |