 |
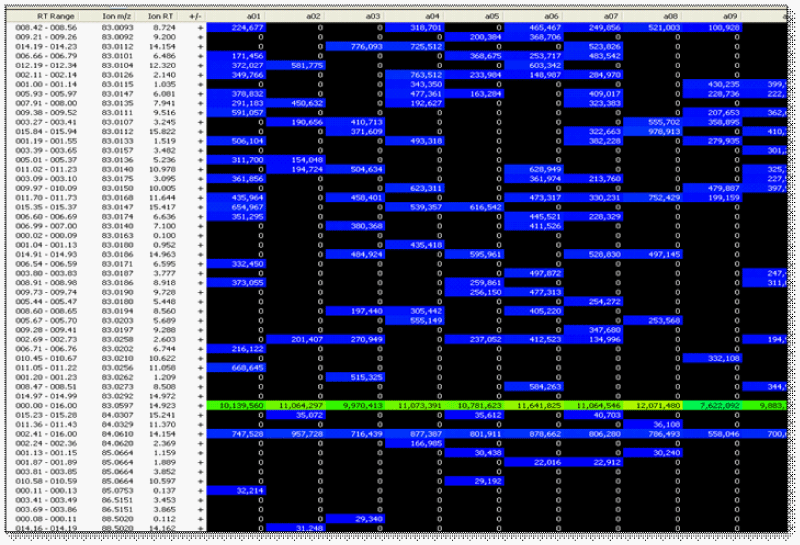
| Figure 1: Ion matrix generated using profiling solutions software after data treatment for noise reduction shows extracted significant m/z values at particular retention time. The columns shows intensity of all the significant ions extracted for any particular sample whereas the rows represent intensities of a particular m/z at definite RT for each sample. |