|
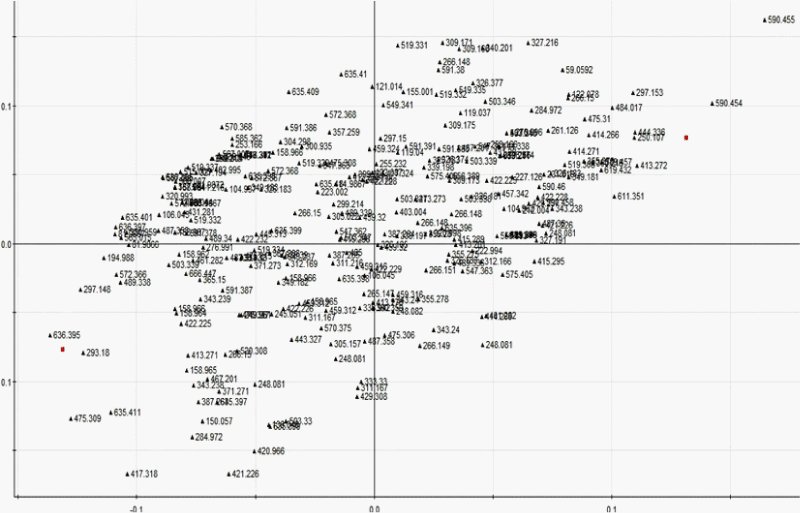
| Figure 3: An example of a typical loading plot. This plot shows m/z values for urine samples spiked and un-spiked with crushed paracetamol tablets (1mM to 1fM concentrations). The m/z values plotted here can be overlaid with the corresponding quadrants of PCA plot shown in figure 2. The m/z value of paracetamol detected negative ion mode is indicated with red circle which corresponds to the quadrant in which majority of paracetomol spike urine samples were observed on the PCA plot (see figure 2). |