 |
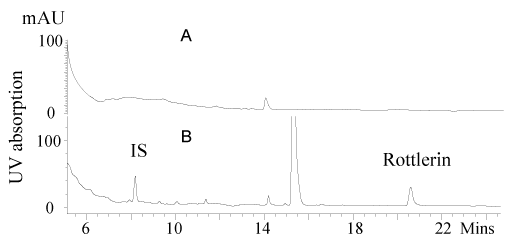
| Figure 2: Representative HPLC chromatograms of mouse tumor monitored at 286 nm. (A) Tumor from a mouse treated with control diet (top) and (B) from rottlerin-treated mouse (bottom). The peak at 14.9 min represents BHT added as antioxidant. IS, internal standard. |