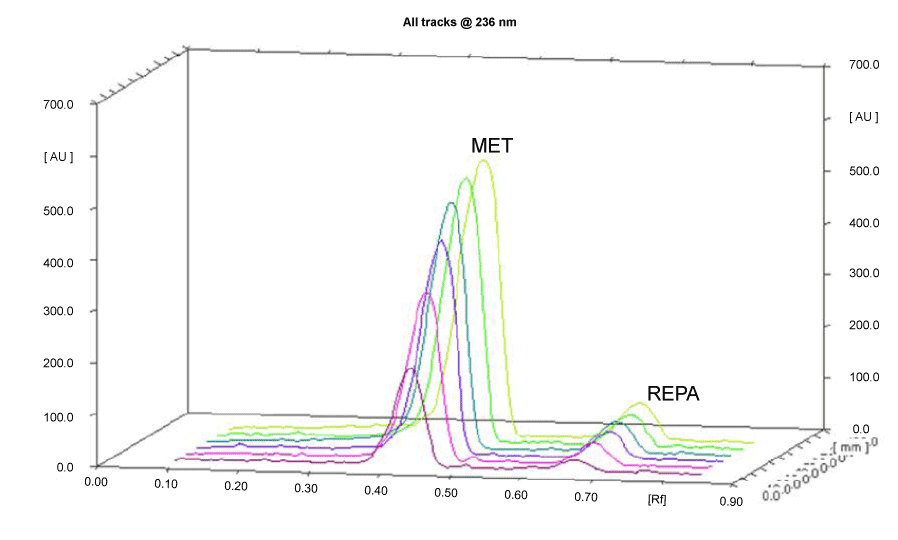
Figure 2:
Three dimensional overlay of HPTLC densitograms of calibration bands of MET and REPA.