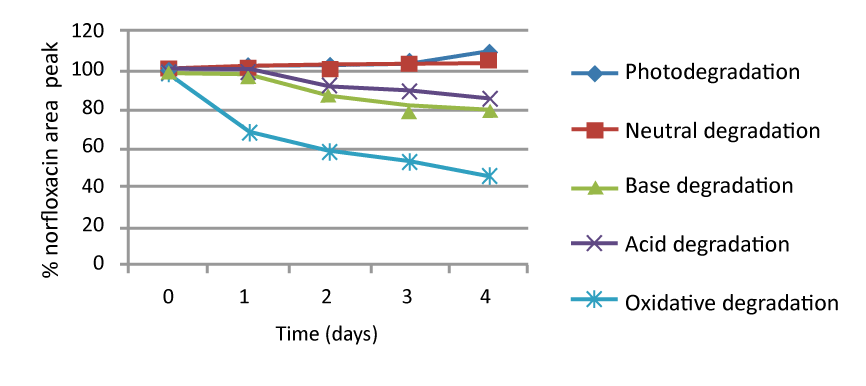
Figure 3:
Plot showing the changes % norfloxacin area peak vs. time. Mean values.