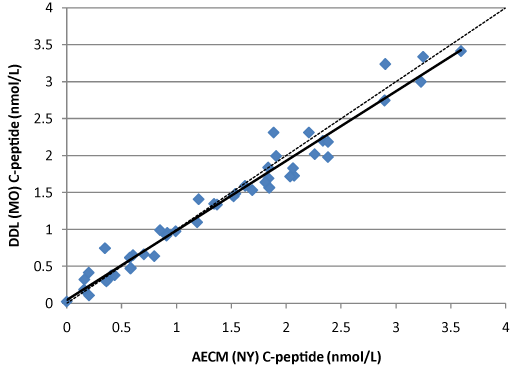
Figure 2:
Method comparison between the MO and NY laboratories; n=47, y=0.941X+0.047. Solid line is the regression line; dashed line is y=x.