 |
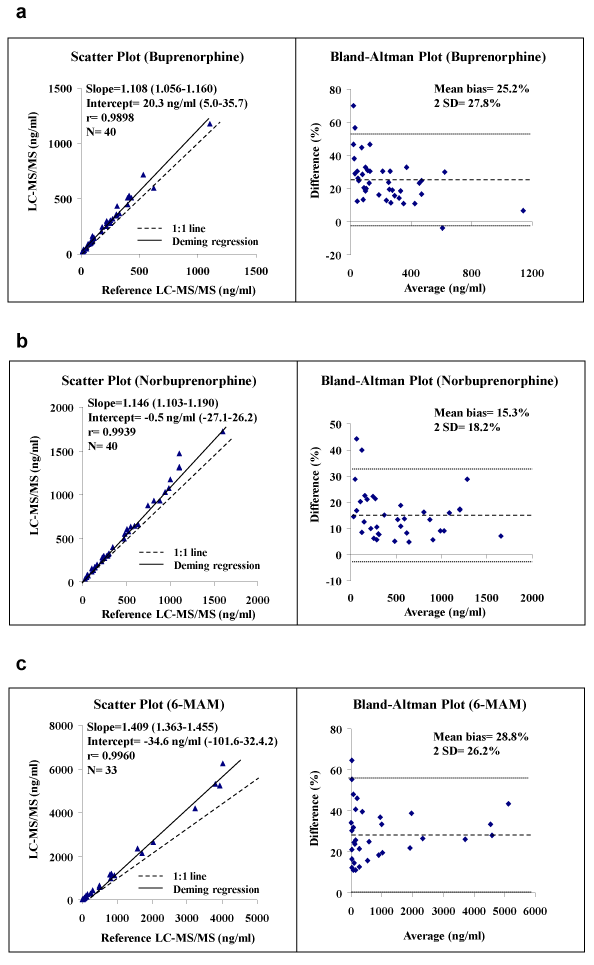
| Figure 3: Method comparison. Leftover patient samples were split and analyzed by the reported method and an independent LC-MS/MS method. Results obtained from both methods were quantitatively compared using Deming regression (left panels). The determined slope, Y-intercept, and correlation coefficient (r) are shown. Numbers in parenthesis are 95% confidence intervals. Bias was analyzed using Bland-Altman plot (right panels) in which dashed line represents mean percentage bias, and dotted lines represent ± 2SD. |